Interpreting Current Auto Industry Trends: Economists Weigh In

In this recap of our August 5 webinar, “Market Pulse: Interpreting Current Auto Industry Trends,” Amy Crews Cutts, President and Chief Economist at AC Cutts & Associates; Jonathan Smoke, Chief Economist at Cox Automotive; and Tom Aliff, Risk Consulting Leader at Equifax, provide insights on the current and future Automotive Industry. Presenters share their predictions on how long pent-up consumer demand, inventory shortages, and an increase in vehicle prices will last.*
Back to Pre-Pandemic Levels?
Amy Crews Cutts, President and Chief Economist at AC Cutts and Associates, started off the webinar with a recent U.S. economic update. According to Cutts, there was a 6.4% growth in the second quarter GDP. This number has brought us back to the pre-pandemic levels but not the pre-pandemic trends. However, even when we hit that trend, Cutts mentioned it is important to note that some coming out of this recession will never get back what they lost during the pandemic.
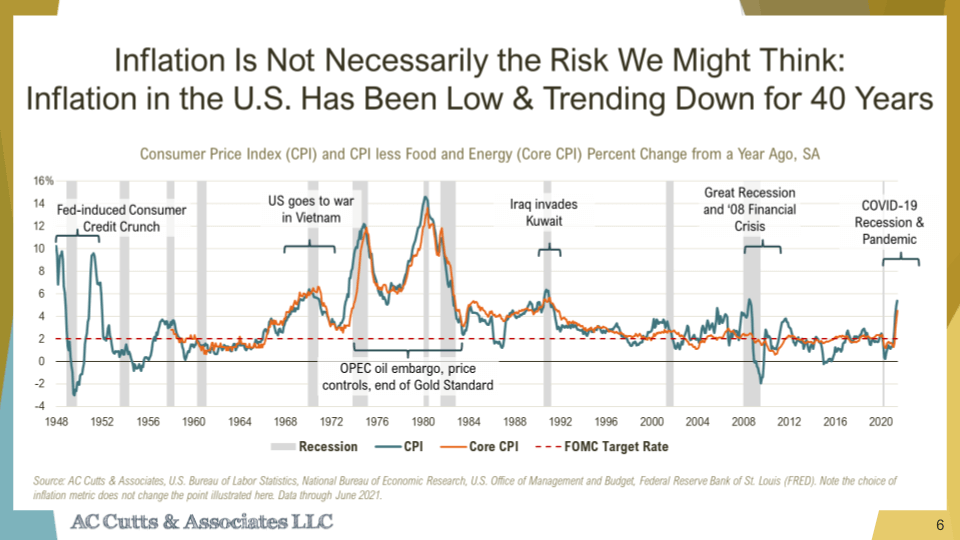
Inflation is dominating headlines. Macroeconomists are undecided on what kind of situation we are in today. Cutts highlighted the inflation by looking at the Consumer Price Index (shown below). Right now, we are in a period of long and small inflation. This deviation from 2% to 3% may seem high, but overall, according to Cutts, it is not.
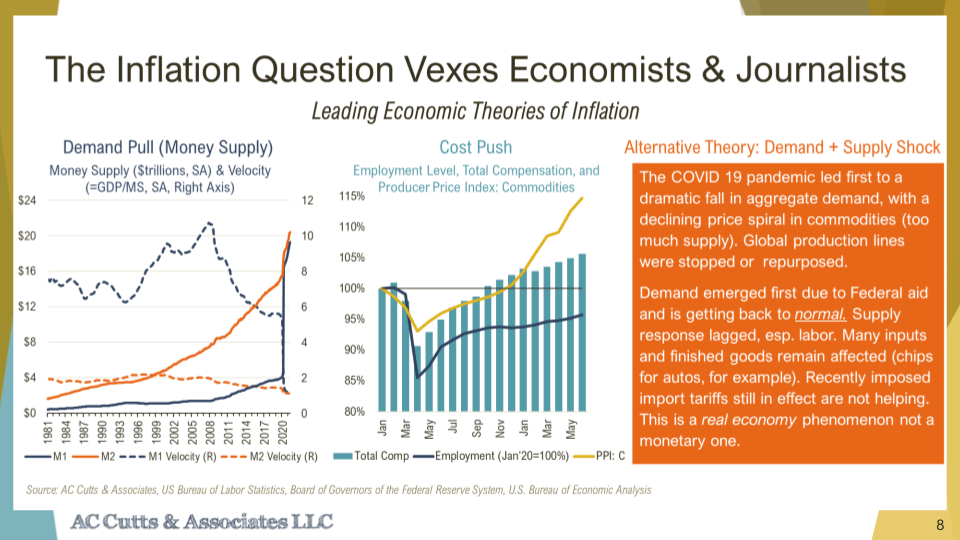
Next, Cutts cited three economist theories: demand pull, cost push, and mix. According to the demand pull side, money supply is higher and velocity should continue to rise. Instead, according to Cutts, we've seen that the velocity has gone way down. It's true for both M1 (shown below), which is demand deposits like checking accounts and less liquid accounts, like money markets and savings accounts (M2 added into the M1).
The cost push side states that wages are driving it up. That being said, the prices of goods and raw materials like lumber, are leading to that. The commodity side of the producer price index is rising sharply. However, most of the alternative theory, described below, is a temporary phenomenon. Cutts believes within a year that we'll be back to a more normal baseline.
Digging Deeper into CPI Inflation
Next, Cutts looked deeper into what's causing the Consumer Price Index inflation. According to Cutts, when we look at the moving components, used vehicle prices and gasoline are big drivers of the high inflation rates. These rates are up 50% to 60% compared to a year ago, which is a huge increase. Cutts indicated that new vehicles are rising strongly but at a tenth of the rate of used vehicles and gasoline.
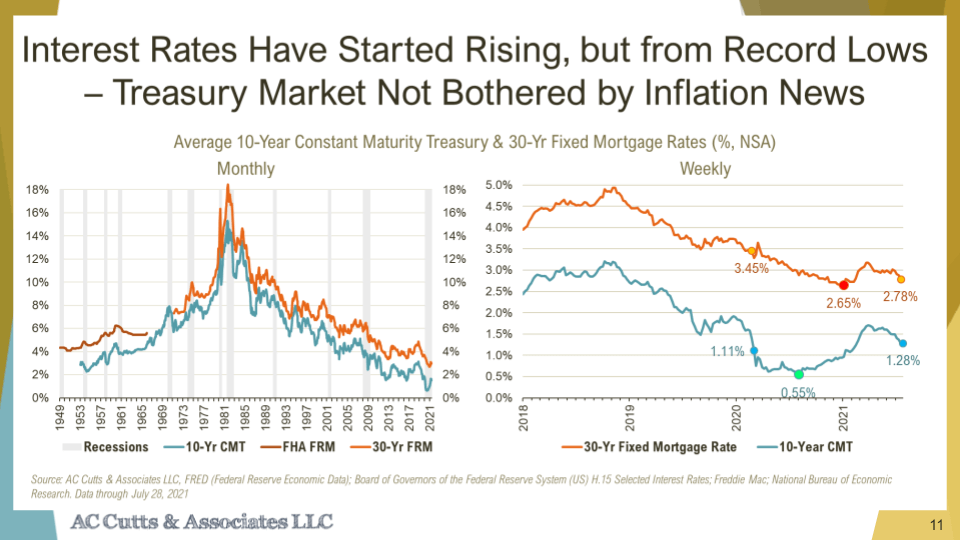
The CPI for all households has stayed in line. There was a dip during the early part of COVID, but it has come back to its baseline level of 3%. Rent, medical care, and all food and beverages have moderated considerably. This is another reason why Cutts believes we're largely seeing temporary impacts on inflation. Interest rates, treasury rates, mortgage rates, and auto rates have all come down. Interest rates are coming off of historic lows (shown right).
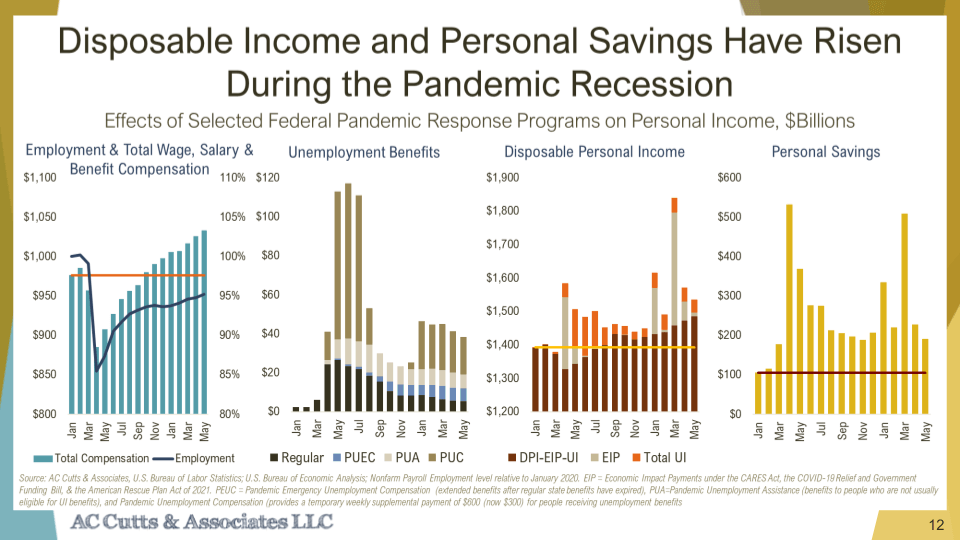
Some noteworthy points shown below include: the total compensation is higher than pre-pandemic levels; while many people are still out of a job, those that have jobs are saving more and likely have more disposable income. The pandemic unemployment compensation (PUC) is the extra $600 and $300 a week that those on the unemployment rolls are receiving. As a result, disposable income plus total unemployment insurance (shown below) is similar to where we were at the same time last year. Cutts concluded by mentioning that U.S. households are in the best shape ever financially, with the caveat that mortgage forbearance, student loan forbearance, and federal loans have reduced payments that are owed.
Consumer Credit Trends Update
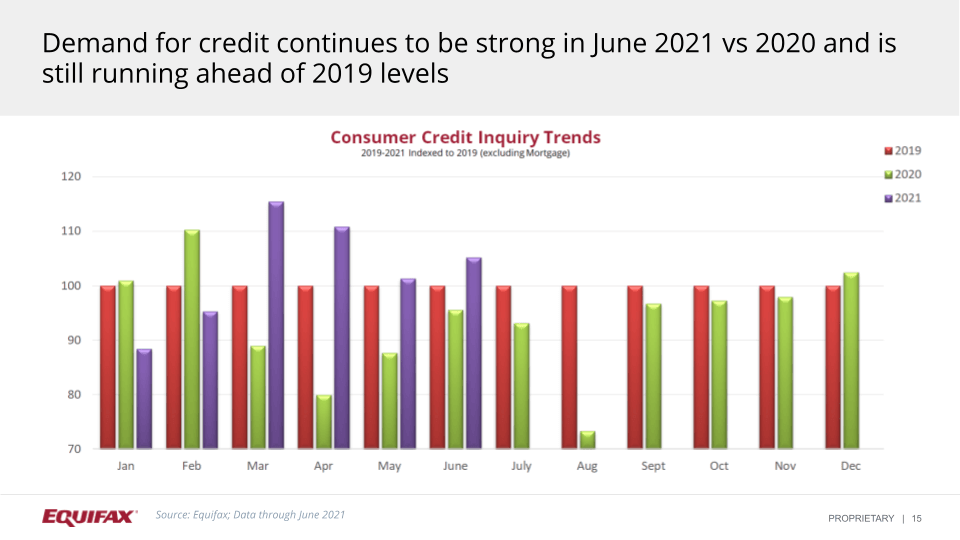
Next, Tom Aliff, Risk Consulting Leader at Equifax, further confirmed the pent-up demand theory. According to Aliff, we've seen that the request for new credit has risen substantially. The slide below shows an index month-by-month comparison for 2020 and 2021 indexed to 2019 (this is why the red bars, shown below, across every month are consistent at 100). There was a large drop off in the March and April timeframe. However, it had not returned to the 2019 levels until March of this year. We have been consistently above that throughout this time.
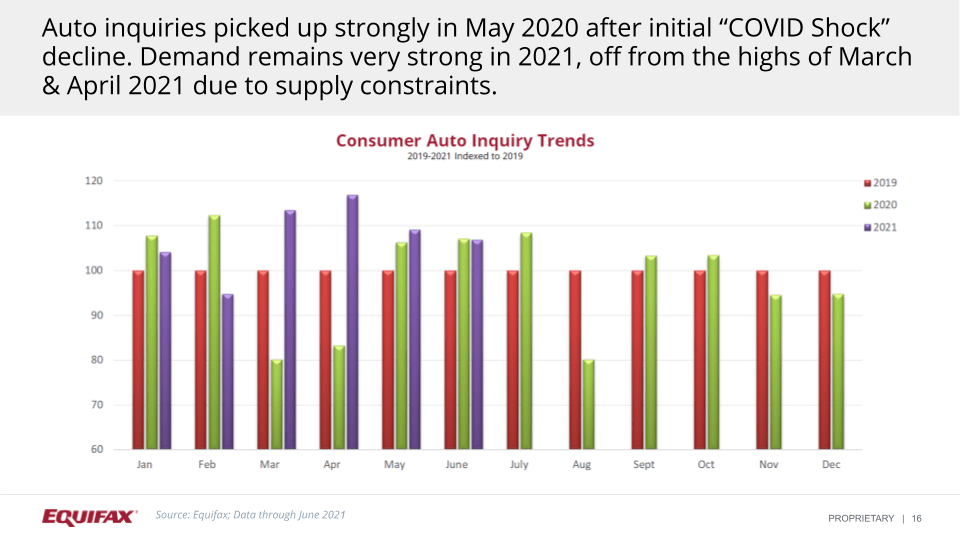
As far as auto credit demand, there was an initial surge in the May and June timeframe. But, this is lower compared to the 2019 timeframe. After January and February 2021 we've seen a rise in demand in March, April, May, and June. There is demand that exists both in the general credit market, but also specifically in auto.
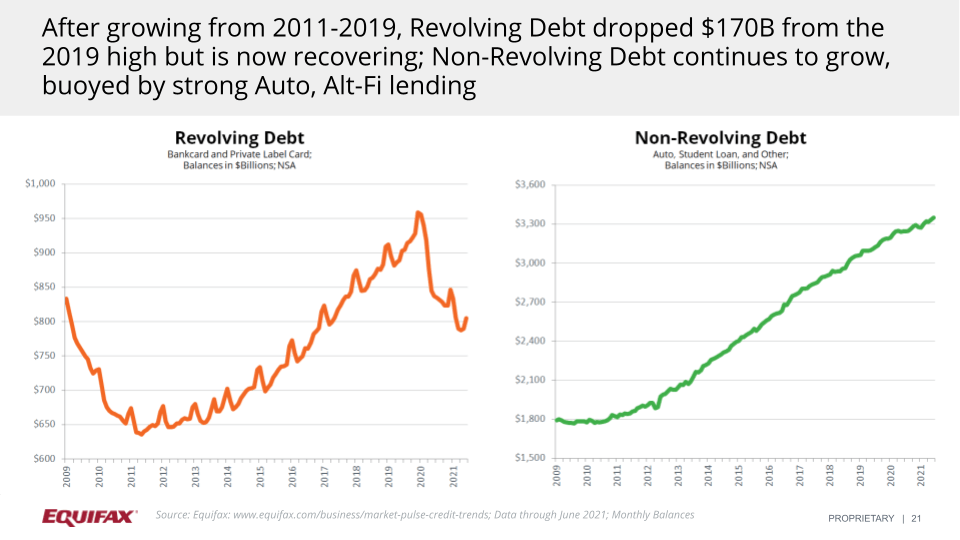
Next, Aliff mentioned that card balances did recover some of their losses during the holiday shopping season. Non-revolving debt saw a slow down during the same period. Revolving balances are still down $94B from pre-pandemic levels with non-revolving up $51B during the same period (shown below).
Auto Delinquencies
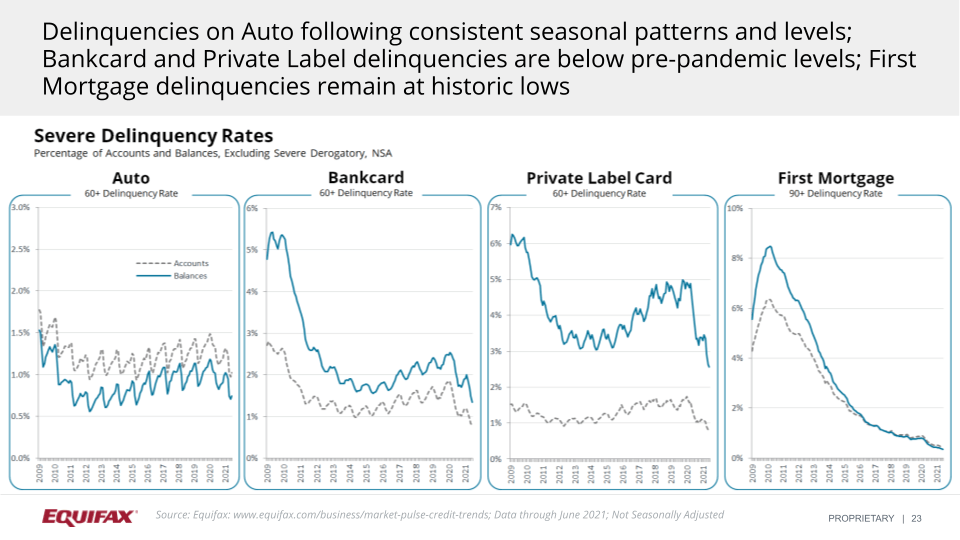
When discussing auto delinquencies, Aliff stated that they have been increasing since the August timeframe (shown below). They are now up 20 basis points from their August 2020 lows. Also, they are 15 basis points below the March 2020 levels. Aliff noted that Equifax is observing that the delinquency rates are lower than they've been. They are operating around the same as the 2016, 2015 timeframe. Aliff also indicated that Equifax is continuing to see some of the seasonality trends with respect to the delinquency rates. Bankcard delinquencies continue to rise but are still 47 basis points off March 2020 levels. Private Label card delinquencies have leveled off over the past few months and are hovering about 160 basis points below their March 2020 levels.
Peak Frenzy in the Auto Industry
he final presenter, Jonathan Smoke, Chief Economist at Cox Automotive, continued Aliff’s conversation about retail sales and the spring activity. Smoke uses the Cox Automotive platform, Dealertrack®, to see what retail sales look like week-by-week. The estimates for those sales are compared to the same weeks in 2019 (shown below). The graphs below show that we had a “frenzy” around the end of March through the first half of May. At the highest point of that time period, Smoke presented that new and used retail sales were up 20% compared to what they were in the corresponding weeks in 2019. This is amazing especially since 2019 was the highest year in history for used retail sales until now.
In Smoke’s observations, we are now 10 weeks after the end
of the “peak frenzy” as we have seen slowing through June and the
beginning of July. The new vehicle sales fell to 4.8 million in
July, when it had been 18.8 million in April. According to Smoke,
this is most likely due to supply. The new market has hit a wall on
supply. As a result, we have seen strong inflation and declining
incentives. 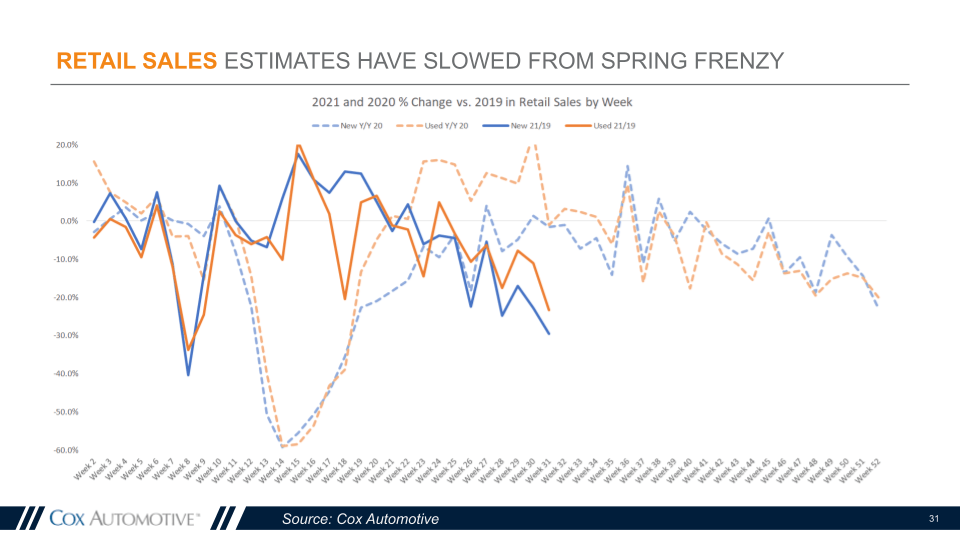
Next, Smoke showed an illustration of the Dealertrack® auto loan credit indices. These illustrations tell us that credit conditions have been favorable this year. Credit conditions have supported the peak frenzy that we saw in the spring. They continue to be favorable and, according to Smoke, will continue to support strong demand with the only limitation being supply and price increases.
Dealertrack® is one of the two platforms that handle most of the indirect lending in the auto industry. Dealers use Dealertrack® to connect with lenders and originate loans. To produce these metrics, Smoke indicated that Cox Automotive looks at approval rates on each individual loan, the subprime share, the yield spreads on the loans, and the terms on the loans, to see if overtime is credit looser or tighter.
According to Smoke, the pandemic last year caused
tightening. But in the fall, Cox Automotive started to see
loosening as a result of strong vehicle values and better than
expected loan performance. Loosening accelerated this spring, and
trends over the last three months have been up and down. Cox
Automotive is still seeing (shown below) what they saw in the
spring. For all types of loans, it is easier to get auto credit this
year than it was a year ago. 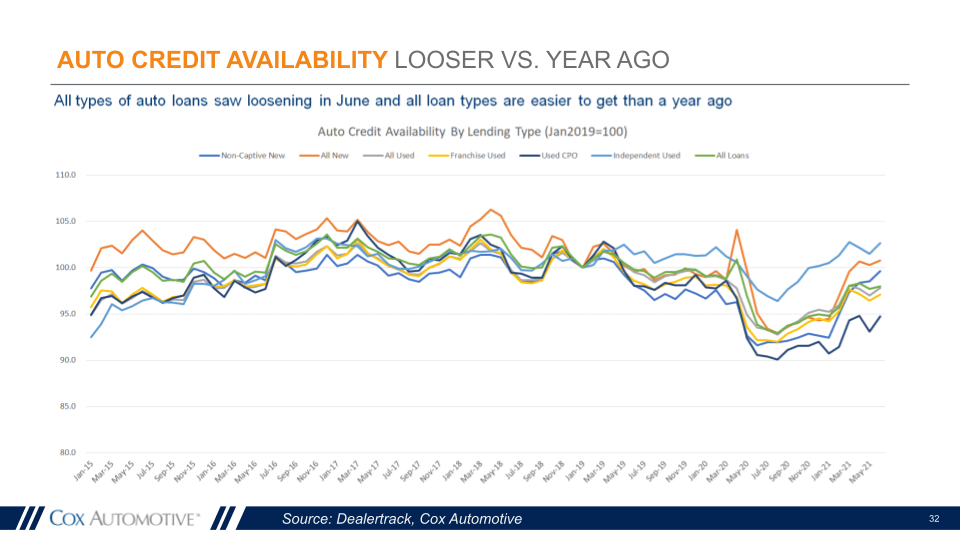
One the next slide, (shown below) Smoke showed that auto
credit was in a tightening cycle before the pandemic began.
However, mortgage credit was not in a tightening cycle. Then, both
of them tightened sharply last year. But, this year the two have
diverged. According to Smoke, auto lenders have unwound last
year's tightening while mortgage lenders appear to have started
to, but then tightened through the latest data point in June. 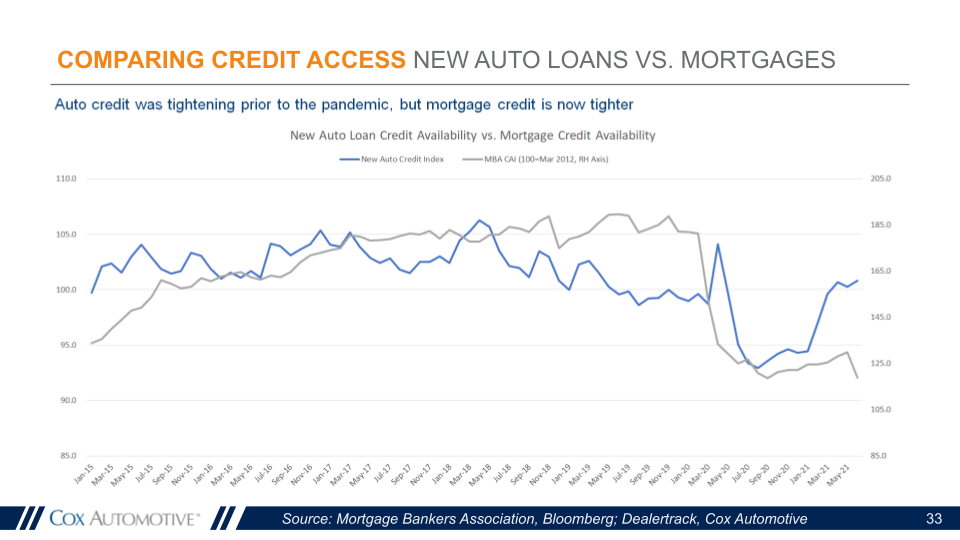
Inventory in the Auto Industry
Last year within auto, there was a difference between what
the highest credit tier was seeing in terms of lower rates, versus
what lower credit tiers were seeing. For consumers who had great
credit, 2020 was a great year to finance big ticket items like homes
and new cars. However, the story has improved this year for all
credit tiers on auto and those with lower credit. Even when bond
yields started to rise earlier this year, Smoke indicated that Cox
Automotive saw declining auto rates. Rate spreads, which widened
last year, have narrowed and remain more attractive this year. It's
especially true for lower credit tier borrowers. 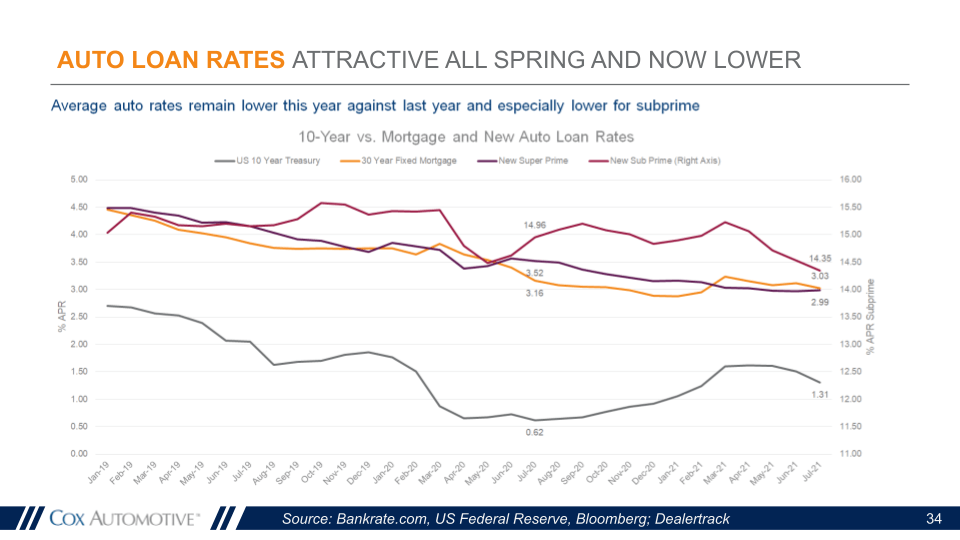
Smoke also indicated that the new vehicle inventory situation is not getting better. He noted that the frenzy mentioned earlier, coupled with the supply challenges in the new vehicle production worldwide, have resulted in the inventory actually continuing to decline. This year, it is down 70% compared to where we were at the same time in our last normal year in 2019.
Used inventory and used day supply has been a different
issue (shown below). Smoke indicated that there had been lower
inventory earlier in the year. But, for the last three months, Cox
Automotive has seen gradual improvement in retail inventory. Days’
supply in used vehicles is inching close to normal, but it’s still
down about 10%. Used vehicle prices are past their peak and are
starting to normalize, but new prices are likely to continue to
display inflation. The inflation in the new vehicle market has been
a fraction of the inflation that the economy has seen in the used
vehicle market. 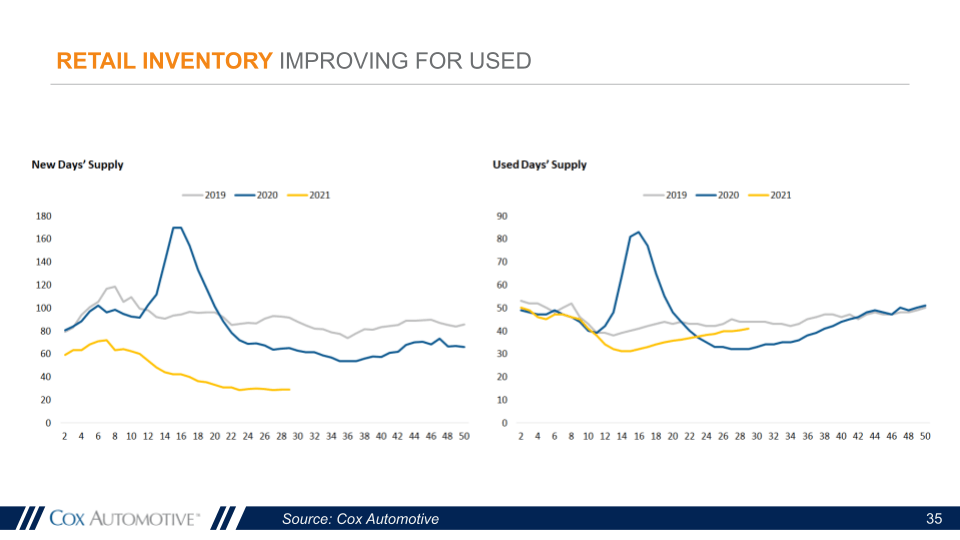
Smoke concluded by displaying the chart (shown below), which
shows that wholesale prices have been declining now for seven
straight weeks, declining an additional 0.3% last week. This is
slowing into a level of decline that is consistent for this time of
the year. Retail prices peaked three weeks ago, and for two straight
weeks in a row retail prices declined, declining an additional 0.2%
last week. That being said, this transitory period in the used
vehicle market is over. 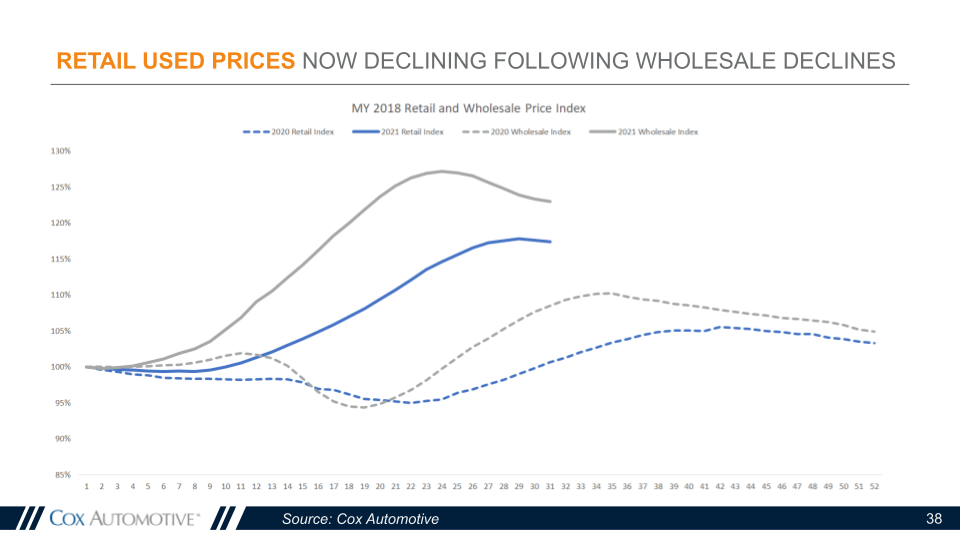
The full webinar recording can be accessed by visiting Market Pulse: Interpreting Current Auto Industry Trends, and you can download a copy of the presentation slides here.
For more information, check out our Q&A blog from our 8/5 Market Pulse webinar, here. Interested in joining a future Market Pulse webinar? Register here. And, if you would like to speak to an Equifax representative about any of the data or solutions mentioned in this blog, please contact us today.
*The opinions, estimates, forecasts, and other views published herein represent the views of the presenters as of the date indicated and do not necessarily represent the views of Equifax or its management.
Recommended for you

