What Does a K-Shaped Recovery Mean for the Economy?
What Does a K-Shaped Recovery Mean for the Economy?

We captured key insights from the January 14 webinar, Market Pulse: Planning in a K-Shaped Recovery, featuring Cris deRitis, Deputy Chief Economist, Moody’s Analytics; Amy Crews Cutts, President and Chief Economist at AC Cutts & Associates; Jennifer Cox, Risk Solutions and Consulting Leader; and Thomas Aliff, SVP of Data and Analytics at Equifax. In this article:
- The New Stimulus Bill Passed. Now What?
- What is a K-Shaped Economy?
- Consumer Credit Trends Update and Predictions
- Income Trends Update
- Alternative Data can Help Manage Risk
The New Stimulus Bill Passed. Now What?
On December 27, 2020 Congress rolled out the additional stimulus bill, which included more than 5,000-pages. Moody’s Analytics summarized the most important financial aspects of the $900 billion plan. The key focus areas of the bill include: household financial support, renter support and small business support, according to deRitis. For those struggling financially, the added stimulus provides relief. Furthermore, it's instrumental in enabling the economy to move forward and reestablish the labor market.
Households received one-time stimulus checks for those earning under $75,000 annually and 11 weeks of supplemental unemployment insurance. Additionally, it included funding for education, childcare and the Supplemental Nutrition Assistance Program (SNAP), formerly known as food stamps.
Renter support included emergency relief funds. They will be distributed by states and an extension on the eviction moratorium through January 31.
Lastly, small business received additional funds for the Payroll Protection Program (PPP). They also received funds for small business loans and grants. 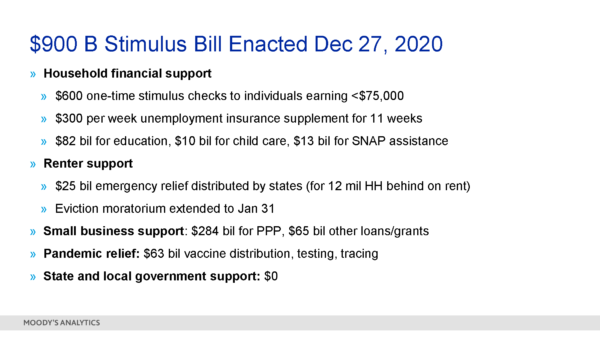
State and Local Government Left Out
State and local government funding is notably missing from the bill, explained deRitits. They are experiencing increased financial stress due to Covid-19. This means their revenues have decreased due to lower income, property and sales taxes. The financial strain is leading to employment cuts. And that will lead to even further financial and employment implications for the economy, deRitis cautioned.
Additionally, deRitis predicted the Biden administration will move quickly to work with Congress to pass additional relief aid. That could include funding for state and local governments and further extension of the eviction moratorium.
DeRitis emphasized the positive role the CARES Act and stimulus played in the overall economic outlook through its positive impacts on household incomes. The image below helps to illustrate this by examining the wage and salary income of all households in the country (green line) versus disposable income (blue line).
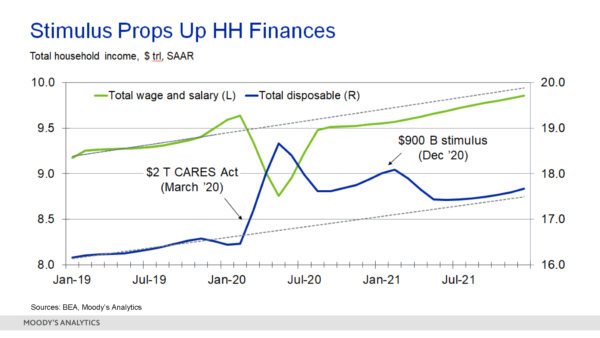
The initial sharp decline of wage and salary income can be seen in March/April of 2020 as lockdowns commenced. Because of the lockdowns, deRitis said the U.S. “lost about a trillion dollars on an annualized basis of household wage and salary income.” This coupled with the 14% unemployment rates experienced in the second quarter of 2020 could have skyrocketed delinquency and default rates, but the stimulus helped prevent that. DeRitis explained that “total disposable income actually remained intact and actually increased throughout 2020 as a result of the CARES Act.” After the December bill was passed, another uptick was seen. However, deRitis further noted that “in all likelihood, some additional stimulus will be needed before we really see this economy running again.”
What Is a K-Shaped Economy?
There has been much debate around the type of recovery that the U.S. is in, but deRitis explained that the recovery is ultimately a K-shaped one because its economic impacts vary depending on the individual. As the image below depicts, the economy is divided between those experiencing financial growth and those who are experiencing financial decline due to the pandemic. The upper end of the K shows economic growth and includes stockholders, homeowners, tech industry, financing industry and men. The lower end of the K shows economic decline and includes renters, hospitality, retail and women. Additional trajectory differences can be seen regionally and in degree holders versus their non-degree holding counterparts. Furthermore, deRitis noted that “we’re seeing greater polarization in income, health outcomes, education outcomes. Across the board, we see a greater level of inequality." 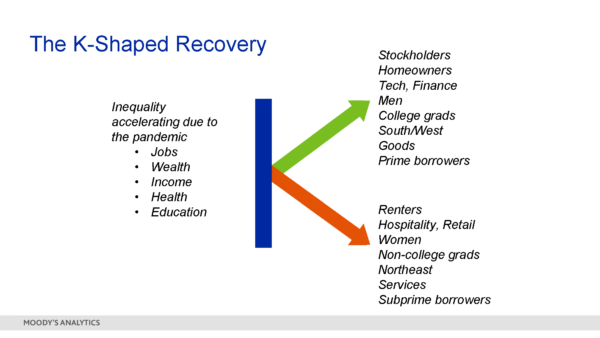
Amy Crews Cutts explained that data supports the K-shaped recovery. The major data impacts that Cutts referenced include:
- Low-income workers, who have the least amount of financial spending flexibility, are being harder hit by the recession and have experienced the majority of job loss.
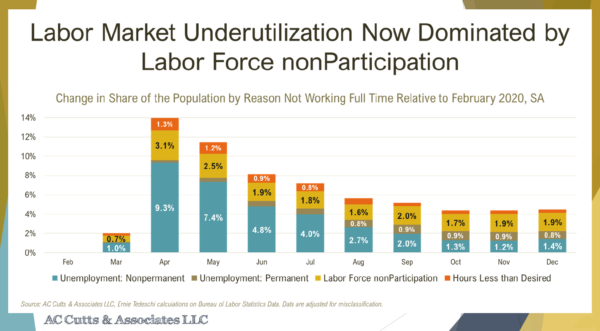
- The share of those temporarily unemployed is down; however, those permanently unemployed are up and growing. The number of labor force non-participation is now the largest of all. According to Cutts, this shift may be due to the labor force staying home as caregivers or that they cannot find jobs.
- The U.S. is down 9.8 million jobs, while December saw a decline in payroll employment (nonfarm jobs).
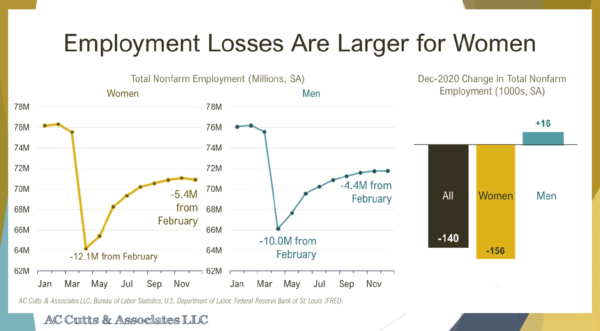
The Impact on Women
- Total non-farm employment shows women are down 5.4 million jobs and men are down 4.4 million jobs. December 2020 numbers showed that women lost 156,000 jobs, while men gained 16.
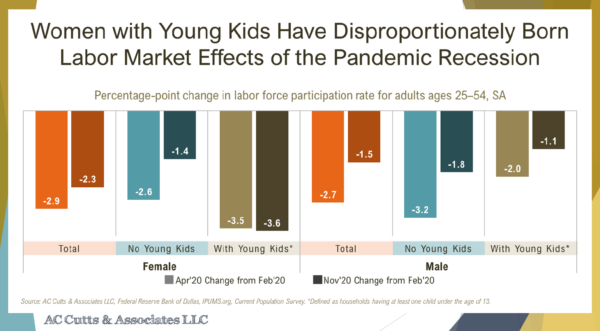
- Women with young children (under 13 years old) are hit disproportionately in the labor market compared to both other women without kids and males with and without young kids.
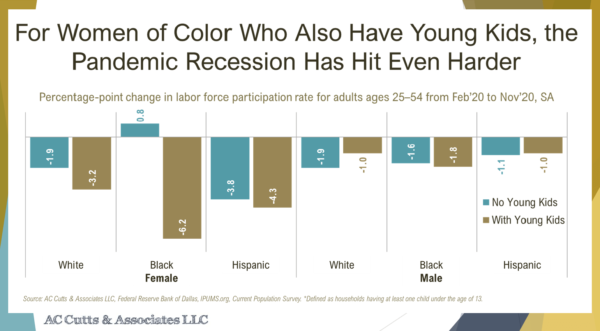
- The recession hit women of color with young children the worst. They were down 6.2 points in labor force participation.
- In women with no college degrees versus those with college degrees, the non-degree holders are hit harder than those who have degrees. Black women who are degree holders and have no young children saw a big boost in their labor force participation in December, but Cutts believes this is a one-month anomaly given previous months’ numbers.
Unemployment Continues to Rise
DeRitis added that January and February will likely continue to see unemployment numbers increase due to further COVID-19 impacts. When a vaccine becomes more widely available and if people move forward with actually getting the vaccine, the number will start to level out. But that likely won’t be until the second half of this year. He also explained that it isn’t likely for the unemployment numbers to equalize until the end of 2022 or even the beginning of 2023.
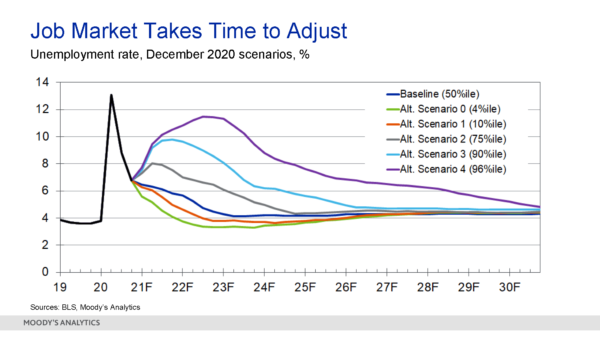
Furthermore, Moody’s Analytics created a simulation of the economy that constructed various outcomes at the tails of vaccine distribution. There are numerous possible outcomes with scenario zero being the best and four being the worst. Scenario zero would mean the vaccine distribution and stimulus packages are very effective and would enable unemployment to equalize the fastest. Scenario four shows the outcome if vaccinations see global resistance and if there are additional shocks from countries being unable to contain the pandemic. In this case, unemployment numbers would spike and take longer to equalize. Overall, deRitis added that the expectation is that things will get better over time for the labor market and the outlook is positive so far, but cautioned that a lot could go wrong in the short term.
Consumer Credit Trends Update and Predictions
Jennifer Cox provided key consumer credit trend updates. Download your free, full report of the Equifax Credit Trends report.
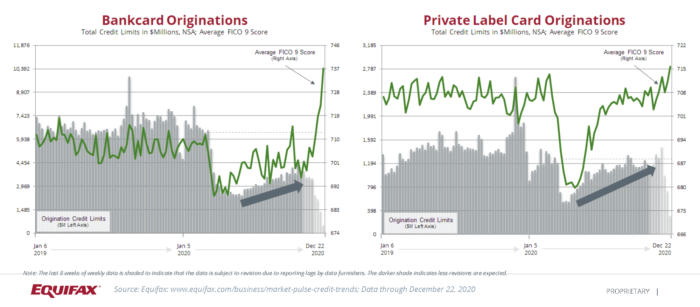
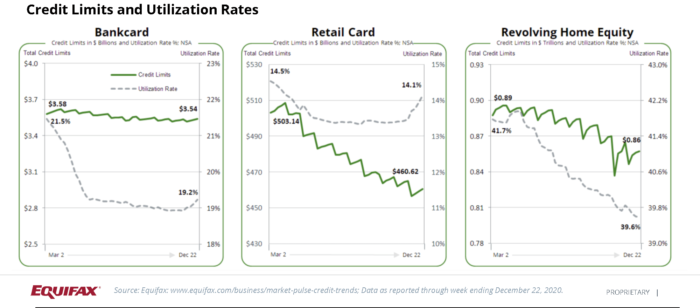
- Bankcard originations continue to increase, but remain significantly below pre-COVID levels; aggregate bank card limits also below pre-COVID levels.
- Private label card originations are back to early 2020 levels, while average credit scores have returned to pre-COVID levels.
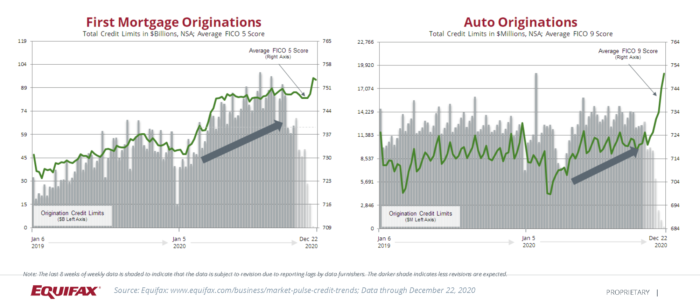
- First mortgage originations remain strong. In fact, they are about two times 2019 levels and there is an increase in the average FICO Score of roughly 20 points since the beginning of the pandemic. This means the new loans coming in are higher quality and lower risk than previous vintages.
- Auto originations dropped early in the pandemic, but are now above pre-COVID levels; the average FICO Score has also rebounded to a similar level as 2019.
- Mortgage shows a marked shift to a higher average risk score.
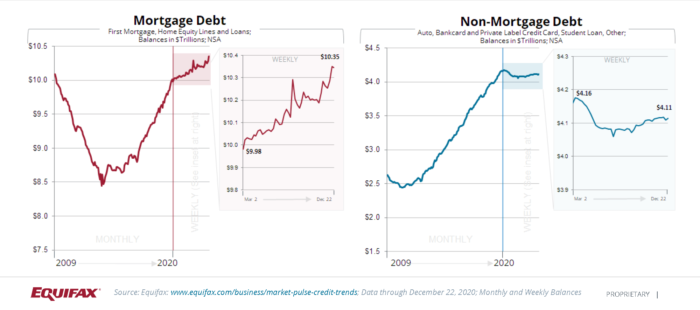
- Mortgage debt has increased by $370 billion since March 2020.
- Non-mortgage debt dropped by $50 billion since March 2020. A reduction in credit card balances drove these results.
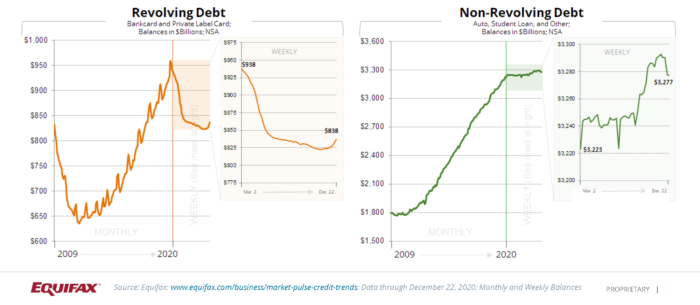
- Revolving debt has declined by $100 billion since March 2020; Non-revolving debt increased by $54 billion in the same period.
- Utilization on bankcard and retail card has increased with holiday spending, while usage of home equity lines continue to decrease.
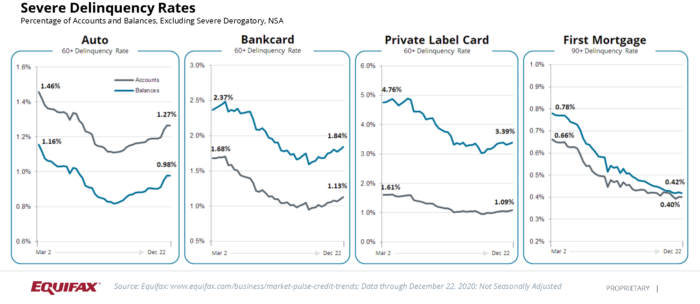
Delinquencies on auto, bankcard and private label card continue to increase, but are still below pre-pandemic levels; first mortgage delinquencies continue to decline.
An Increase in Delinquency
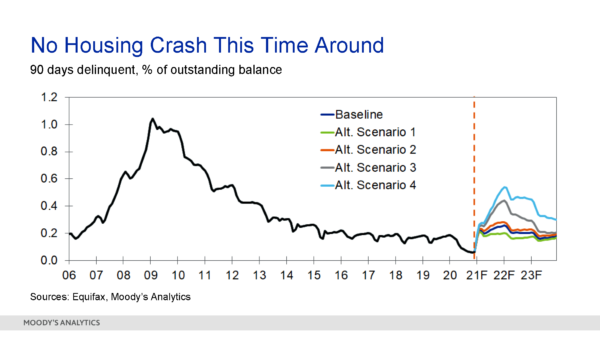
DeRitis expanded on Cox’s consumer trends reporting with further simulation models of what Moody’s Analytics predicts. He explained that delinquency rates for mortgages have been low and that is in part due to forbearance and payment deferral programs. However, as those initiatives begin to expire he predicted that “we would expect to see a natural reversion of the delinquency rates or an increase in delinquency rates.”
This will be more extreme for those who are struggling with unemployment. DeRitis expects the baseline return to be in line with pre-pandemic levels. As shown in the image below, delinquency levels can fluctuate between the best-case scenario one and the worst-case scenario four. But even in the worst-case scenario, delinquency levels “don't come anywhere near the level that we had during the last financial crisis," according to deRitis. Additional stimulus and pandemic resolution could help the delinquency levels from rising as well.
Economists expect bank card and auto delinquency levels to remain low and are forecasting a downward trend, as can be seen in the image below. Private labels, however, show more volatility in the short term particularly because of the strong seasonal patterns in retail cards. But economists predict overall rates will remain low. Additionally, deRitis explained that consumer finance, which includes personal and FinTech loans, may see a return to upper levels of delinquency. This would be similar to levels seen before the pandemic. However, they should remain relatively low if positive actions like more stimulus and pandemic containment are achieved in 2021. 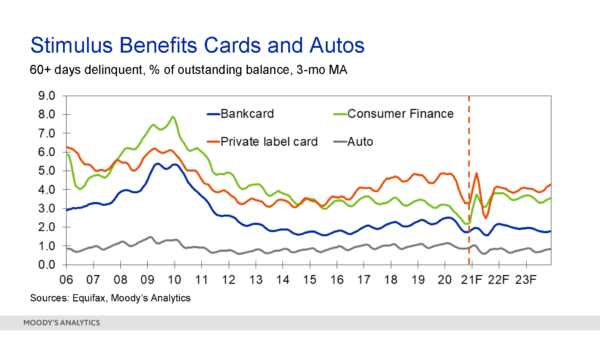
Lastly, deRitis said overall household debt is likely to stay relatively modest. That's because consumers are more resistant to taking on additional debt. Economists predict debt levels will rise in line with incomes or the broader economy. However, deRitis says there could be some variation like acceleration and recovery of spend levels in bank and retail cards. This would be as a result of the service industry opening back up. It would likely occur towards the latter half of the year. Meanwhile, home and auto purchases may expect to slow down in their balance growth. 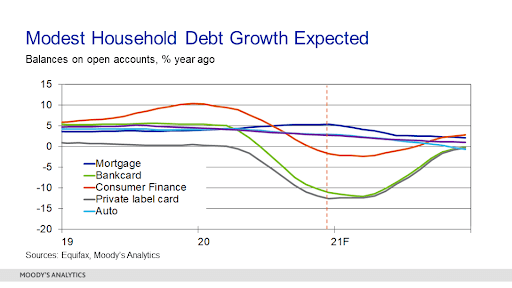
Income Trends Update
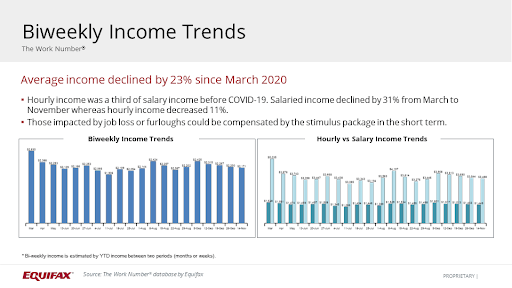
Tom Aliff provided the bi-weekly income trends update:
- There is a 23% decline in wage base income since March 2020, but it does not count jobs lost. Additionally, the stimulus and unemployment benefits have driven some make-up to short-term income loss.
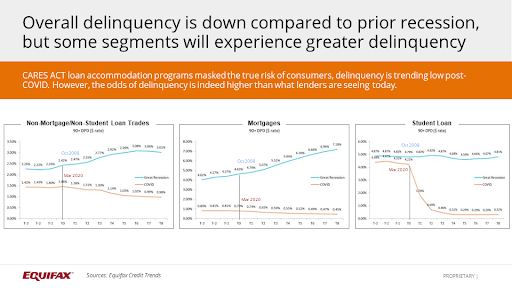
- Delinquencies are on the decline in each of the below charts for non-mortgage, mortgage and student loans. These show a decline in delinquency compared to the blue line of the 2008 recession. However, there are segments of the population that still have greater delinquency despite the overall low delinquency trending numbers.
- As accommodations begin to roll off, this will be an important area to watch closely.
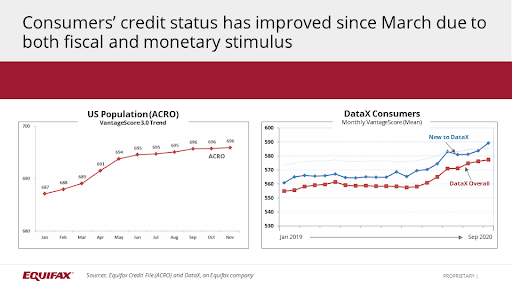
- Despite population economic differences, VantageScore had a nine-point overall increase for all consumers. The paydown of the debts, the balance and utilization reduction, as well as the lower delinquency levels were largely responsible for driving this.
- Consumers in the subprime base of credit increased their scores by about 23 points to 589 since March last year.
- The greatest increase has been the use of disaster codes, the administrative forbearance and the inferred accommodation -- where there’s a balance, but no scheduled payment due.
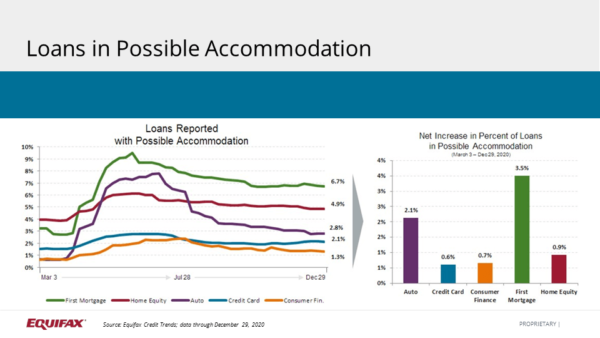
- Loans and accounts that are in possible accommodations status have flattened out since their peak.
- Across all account types, a total of 2.4% of loans or accounts are under possible accommodation versus 1.5% on March 3, 2020.
- First Mortgage and Auto loans have had the highest increase in accommodations.
- Similar to loans, balances under accommodation continue to decrease across all product types. A total of 6.3% of balances were under possible accommodation on December 29 vs. 2.8% on March 3.
Alternative Data Can Help Manage Risk
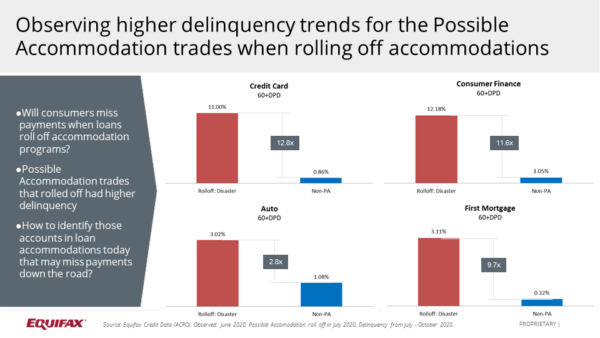
Aliff explained that it will be important to watch payment behavior and delinquency rates as benefits end and loans roll off of accommodations. It's also important to note accounts that went into accommodation status may have already been delinquent at that time and were fixed at the same delinquency rate until they rolled off. In the chart below you can see the initial numbers for accounts that have come out to possible accommodations (PA) are showing higher rates of delinquency than non-PA accounts. These numbers reflect credit card, consumer finance, auto and first mortgages lines of credit. As shown below, delinquency rates are up to 12.8 times higher for credit cards and up to 2.8 times higher for auto tradelines than those not in PA.
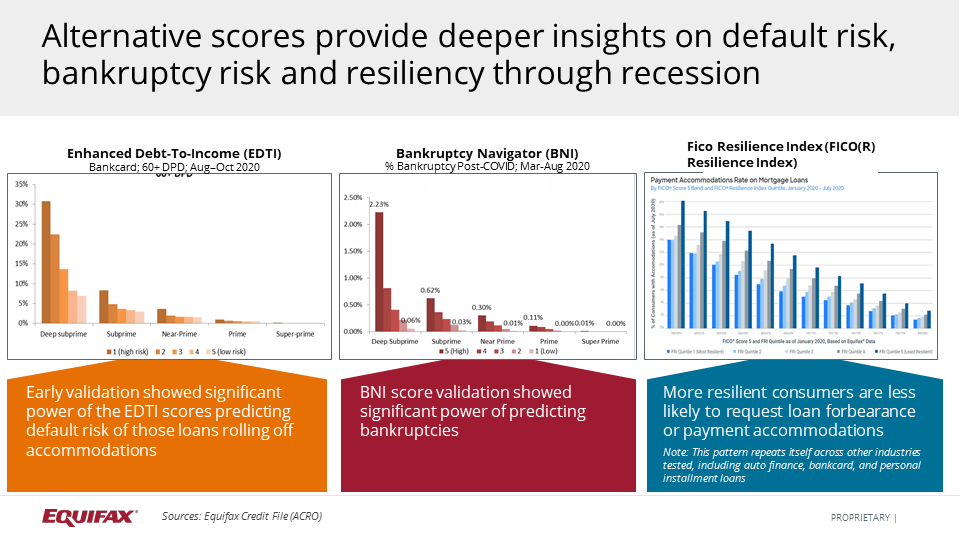
Companies should understand their accommodation population or if consumers are in accommodations at other lenders, said Aliff. Alternative scores can help provide more accurate insights into default risk, bankruptcy risk, as well as consumer financial resiliency through the recession. As shown below, Equifax has three such score models, including:
- Enhanced Debt-To-Income (EDTI), which can help predict default risk in loans rolling off accommodations
- Bankruptcy Navigator (BNI) to help predict bankruptcy risk
- FICOⓇ Resilience Index (FRI), which helps identify consumers less likely to request forbearance or payment accommodations
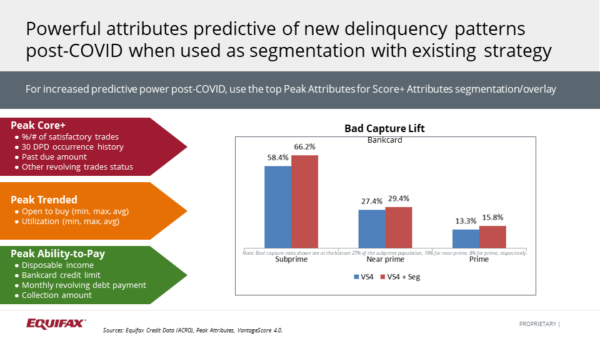
Lastly, Aliff called out the importance of using predictive attributes to segment populations. This makes it possible to identify new delinquency patterns post-COVID. Get more predictive insights by leveraging the Peak Core Plus, Peak Trended and Peak Ability-to-Pay from Equifax. This helps at both the underwriting and account management levels, as well as with portfolio expansion and direct marketing campaigns.
The full Market Pulse webinar recording can be accessed by visiting Market Pulse: Planning in a K-Shaped Recovery, and you can download a copy of the presentation slides.
And, if you would like to speak to an Equifax representative about any of the data or solutions mentioned in this blog, contact us today.
Recommended for you